Research Areas
Ongoing topics of research include:
- Source Characterization,
- Confined Treatment Unit Operations,
- Soil Treatment and Dispersal,
- Microbial Assessment, and
- Modeling and Decision Support.
Selected previous and ongoing studies within each of the topic areas are highlighted below. Complete references can be found on the publication page.
Source Characterization Highlights
Prevalence of pharmaceuticals and personal care products in onsite wastewater: Over 30 systems representing onsite treatment units serving a variety of wastewater sources have been monitored and the potential removal mechanisms evaluated. Results suggest a range of organic compounds are prevalent in onsite systems with 80% of the compounds detected in 1 or more samples at concentrations ranging from less than0.5 to 4500 µg/L (Table RA1). The occurrence and fate of these compounds in soil treatment units was also evaluated. Generally low removals were observed in the septic tank (less than 35%) with higher removals for some compounds observed in textile filter effluent. High removals (³90%) were observed in 60 cm of sandy loam soil. Results from 64 anaerobic septic tank effluent samples collected in Fall 2003 and Spring 2004 suggest a range or organic compounds are prevalent in onsite systems (Table RA1). Additional information can be found in Conn 2008 and Conn et al. 2006 with additional publications forthcoming.
Composition of raw wastewater and septic tank effluent (Fig RA1): The composition and variability of raw wastewater and septic tank effluent (STE) from residential OWS was evaluated. A literature search was initially conducted to assess the current understanding of raw wastewater and septic tank effluent composition. Cumulative frequency diagrams and summary statistics prepared illustrate waste characteristics based on wastewater source (e.g., residential vs. commercial) and type (e.g., raw vs. STE). Eighteen sites located in Colorado, Minnesota, and Florida were monitored quarterly. A large data set from residential OWS encompassing region, occupancy, age of occupants, and seasonal variations was generated providing a better understanding of the modern waste stream (raw and STE) composition. Median values and CFDs were determined to use as model inputs and evaluate tank performance. Correlations between key design parameters were developed. Finally, mass loading rates were estimated to assess environmental impacts, optimize performance design, evaluate implications of various demographics, and understand household use contributions. The literature search is available at www.ndwrcdp.org/publications (Lowe, K.S., N. Rothe, J. Tomaras, K. DeJong, M Tucholke, J. Drewes, J. McCray, and J. Munakata-Marr. 2007. Influent Constituent Characteristics of the Modern Waste Stream from Single Sources: Literature Review. 04-DEC-1) with the final project report anticipated in June 2009 with additional publications forthcoming.
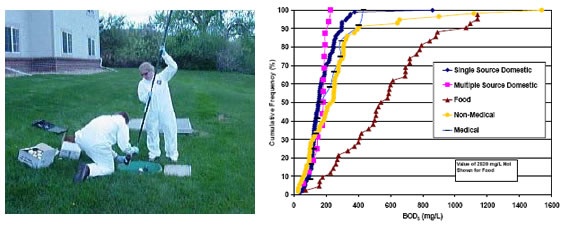
RA1 – Source characterization and monitoring and cumulative frequency distribution of literature values for
BOD5 concentrations in single family domestic septic tank effluent (Lowe et al., 2007).
Watershed water quality assessment as effected by onsite wastewater systems: The potential cumulative effects of onsite wastewater systems within a watershed were assessed through groundwater monitoring and surface water monitoring (see also Modeling and Decision Support below) (Fig RA2). Monthly surface water monitoring at 20 locations was conducted for one year. Groundwater wells, drinking water wells, OWS effluents, and WWTP effluents were also sampled less frequently. The final project report is available at www.ndwrcdp.org/publications (Siegrist, R.L., J. McCray, L. Weintraub, C. Chen, J. Bagdol, P. Lemonds, S. Van Cuyk, K. Lowe, R. Goldstein, and J. Rada. 2005. Quantifying Site-Scale Processes & Watershed-Scale Cumulative Effects of Decentralized Wastewater Systems. WUHT-02-27).
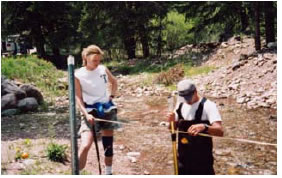
RA2 – Surface water monitoring in the Blue River Watershed.
Confined Treatment Unit Operation Highlights
Microbial characteristics: The microbial community inhabiting septic tank effluent and in-tank aerobic treatment units has been identified and characterized. Samples collected from a traditional septic tank and two septic tanks fitted with aerobic bacterial generator treatment units suggested that the wastewater environments were primarily dominated by two Phyla; Proteobacteria (80-95%) and Bacteroidetes (4-19%). Additional information can be found in Tomaras et al. 2007 with additional publications forthcoming.
Confined treatment unit purification performance (Fig RA3): Monitoring of the effluent quality of three onsite treatment units at the Mines Park Test Site confirm different purification efficiencies for a pilot scale membrane bioreactor (MBR), a textile filter unit (TFU), and a septic tank (MBR > TFU > septic tank). The effluent quality for each unit was reliably consistent, although some variability for individual constituent concentrations was observed (Fig RA4). The final project report is available at www.ndwrcdp.org/publications (Van Cuyk, S., Siegrist, R.L., Lowe, K.S., Drewes, J.E., Munakata-Marr, J., and Figueroa, L. 2005. Performance of Engineered Treatment Units and their Effects on Biozone Formation in Soil and System Purification Efficiency. WU-HT-03-36.) Additional information is described in Lowe et al., 2008 and 2007.
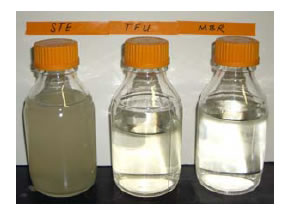
RA3 – Effluents from the confined treatment units at the Mines Park Test Site.
RA4 –Observed removal of constituents in STE by either a TFU or MBR after one year of operation.
Field survey of filter unit performance: Eight textile filter units of different operational configurations were monitored for 4 months in Jefferson County, Colorado. Nitrogen removal was observed in all systems although some variability in individual system performance was noted. Over 99% fecal coliform removals were also observed. Additional information can be found in Wren et al. 2004.
Full-scale membrane bioreactor operation: In partnership with The Advanced Water Technology Center (AQWATEC) at CSM, a full scale membrane bioreactor using sequencing batch reactors (SBR) with submerged ultrafiltration membranes has been installed and is treating raw wastewater from over 20 student housing complexes. (make a link to AQWATECs project description: http://www.aqwatec.com/research/SBMBR/ ). Results and publications will be forthcoming.
Soil Treatment and Dispersal Highlights
Mines Park Test Site for field-scale wastewater reclamation: The performance of soil treatment units receiving onsite wastewater for the removal and transformation of chemicals, nutrients, and pathogens have been evaluated at the Mines Park Test Site. At the test site, the effects of hydraulic loading rate, effluent quality, delivery method, and infiltrative surface architecture on soil treatment and dispersal have also been evaluated.
Natural Soil System Highlights:
In 2003, in situ test cells were established to evaluate the effects of increased daily hydraulic loading rates (HLRs) and different infiltrative surface architectures (ISAs) on the hydraulic and purification performance achieved during soil treatment of STE. Three ISAs (open, stone, or synthetic) and two design HLRs (4 or 8 cm/d) were replicated five times (3 × 2 × 5 = 30 test cells). In addition, 4 test cells were installed and loaded with tap water at design HLRs of either 4 or 8 cm/d. Monitoring has revealed that both the ISA and HLR influence the rate and extent of hydraulic capacity loss during soil treatment. Observed purification of STE during infiltration and percolation is very high. No significant difference in the purification performance has been observed based on ISA or HLR, but an increase in the vadose zone depth slightly increased purification. After 5 years of operation, total phosphorus removals of ~98% and total nitrogen removals of ~30% were observed at 60 cm below the infiltrative surface. Additional information is forthcoming and can be found in Tillotson 2009, Lowe and Siegrist, 2008, Siegrist et al., 2004, and Tackett et al., 2004.Additional test cells were established in 2004 to evaluate the hydraulic and purification performance of the soil treatment unit receiving effluent from three different engineered treatment units: a septic tank, a septic tank with a textile filter unit (TFU), and a septic tank with a membrane bioreactor (MBR). After 32 months of operation, high removal of total phosphorus and dissolved organic carbon were observed after 60 cm of soil for both TFU and STE. Nitrogen removal rates in 60 cm of soil were nearly double in the TFU test cells compared to the septic tank test cells (Fig RA5). After 3 years of operation, total phosphorus removals of ~99% and total nitrogen removals of ~49% were observed at 60 cm below the infiltrative surface. The final project report reflecting the first year of monitoring is available at www.ndwrcdp.org/publications (Van Cuyk, S., Siegrist, R. L., Lowe, K. S., Drewes, J. E., Munakata-Marr, J., and Figueroa, L. 2005. Performance of Engineered Treatment Units and their Effects on Biozone Formation in Soil and System Purification Efficiency. Project No WU-HT-03-36.) Operation and monitoring of the test cells is ongoing with additional information forthcoming as well as described in Tillotson 2009, Conn 2008, Lowe et al., 2008 and 2007, Dimick 2005.
RA5 – Observed total nitrogen concentrations in lysimeter samples (Lowe et al., 2006).The formation of the biozone at the infiltrative surface and the mechanisms responsible for soil clogging have been evaluated. Accumulations of organic material within the first 0.5 cm below the infiltrative surface (the biomat) were found to be about 80% humic substances and 20% polysaccharides with accumulations declining sharply with depth (near background ranges at 10 cm). The structure of the organic material in the biomat consisted of fibers and bundles of fibers. However, no significant variations in water content, TOC or organic matter fractions were observed below 2 cm during the first year of STE loading to the soil. Humin was observed to contribute the most to the soil organic carbon, followed by humic acid and fulvic acid. Additional information can be found in McKinley 2008, McKinley and Siegrist 2007 with additional publications forthcoming.
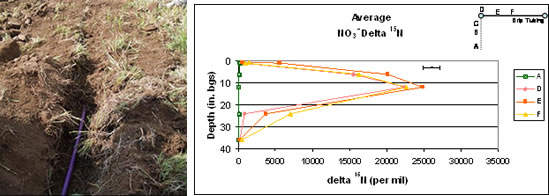
A pilot scale drip dispersal system has been installed at the Mines Park Test Site. Two zones have received STE at either 0.5 or 1.0 cm/d since November 2005. A multi component tracer test utilizing a nitrogen isotope (15N ammonium chloride) suggested that effluent preferentially travels along the drip tubing with the highest ammonium and nitrate concentrations in the samples collected in the rhizosphere and at 2.5 cm bgs (Fig RA6). However, ammonium concentrations were still detectable with depth suggesting non-uniform biozone development and flow. Additional information can be found in Parzen et al. 2007 with additional publications forthcoming.
RA6 – Isotope concentrations with depth along the tubing of the drip dispersal system
at Mines Park (Parzen 2007).
Field survey of 16 systems in Colorado: The hydraulic and purification performance of mature onsite wastewater systems was evaluated. A multi-component tracer test (two bacteriophages, MS-2 and PRD-1, and bromide) conducted at 5 sites suggested no difference in treatment performance in systems with either gravel or open infiltrative surfaces (Fig RA7). Additional information can be found in Siegrist et al., 2000 (pdf) and Lowe et al., 2001 (pdf).
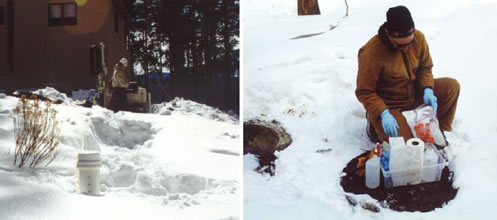
Fig RA7. Field evaluation of onsite wastewater systems in Colorado.
Laboratory-scale wastewater reclamation: Controlled laboratory experiments have been conducted to assess the hydraulic and treatment performance as affected by hydraulic loading rate, effluent quality, and infiltrative surface architecture. In each study, 1D columns and 3D lysimeters packed with a uniform, medium grained sand have indicated consistent performance observations (Fig RA8). Treatment performance with regards to nitrogen, phosphorus, and fecal coliform is affected by hydraulic loading rate and effluent quality, but not the infiltrative surface architecture. Hydraulic performance is affected by hydraulic loading rate, effluent quality, and infiltrative surface architecture. Complete discussions can be found in Fisher 1999, Mason 1999, Beach 2001, Van Cuyk et al. 2001, Diaz 2003 and Walsh 2006.
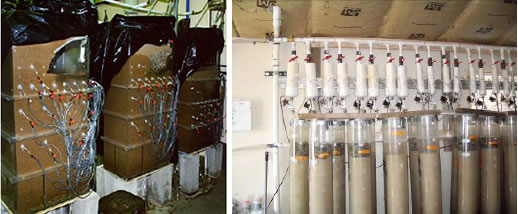
Fig RA8. Laboratory experiments on soil treatment and dispersal.
Microbial Assessment Highlights
Bacterial source tracking: E coli was isolated from fecal specimens collected from source groups including humans, dogs, horses, cows, geese, deer, elk and bears. Following rep_PCR, the resulting densitometric curves were stored in a database and three classification procedures were evaluated to determine if the host groups could be accurately identified (Fig RA9). Bacterial source tracking may be used as a tool during planning to mitigate point and nonpoint sources of contamination. Additional information can be found in Albert et al. 2003.
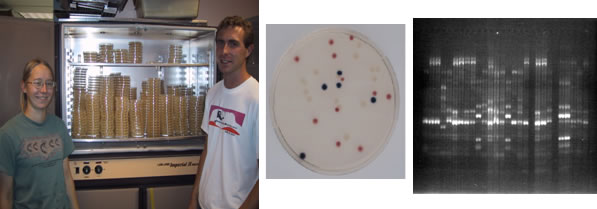
Fig RA9. Microbial assessment utilizing bacteria source tracking.
Virus removal and inactivation: Several laboratory scale experiments have been performed to investigate the fate of bacteria and virus during wastewater treatment. Increased removal of virus may not necessarily be attributed to development of a biozone, but rather the conditioning of the porous media at the infiltrative surface. Mini column studies demonstrated that equivalent or even higher removal of viruses may occur at the infiltrative surface when viruses are applied to soil in higher quality effluent as compared to application in STE. Additional information can be found in Van Cuyk et al. 2004 and Van Cuyk and Siegrist 2007.
Biozone characteristics: The microbial characteristics of the biozone were assessed from samples of the STE and biozone from 2 test cells at the Mines Park Test Site. The top 1.5 cm of infiltrative surface was observed to have both the greatest amount of bacterial growth and abundance compared to the underlying soil. Both the total biomass and the bacterial numbers decreased with depth. While the diversity of microbes in STE is low, the observed diversity in the biozone was high (Fig RA10). The dominant microbe found in the biozone was Gamma Proteobacteria while Epsilon Proteobacteria was most prevalent in the STE. Additional information can be found in Tomaras et al. 2009.
Fig RA10. Microbial characteristics of the biozone from an open infiltrative surface (In: Tomaras, et al., 2007. Examination of Microbial Characteristics of the Wastewater Induced Soil Biozone, Amer. Soc. for Microbiology, May 2006, Orlando, FL.)
Modeling & Decision Support Highlights
Watershed modeling of development impacts: The wastewater sources and effects on water quality in the Blue River Basin of the Dillon Reservoir watershed were quantified using multiple models (WARMF, BASINS, MANAGE). Simulations were conducted that described current conditions or provided insight into future scenarios, such as continued use of onsite wastewater systems and central wastewater treatment plant (WWTP) and conversion of OWS to central WWTP. WARMF simulation of the N and P loadings to the Blue River indicated that with the conversion of 362 OWS to a central WWTP, the nutrient loading into the Blue River could increase. The final project report is available at www.ndwrcdp.org/publications (Siegrist, R.L., J. McCray, L. Weintraub, C. Chen, J. Bagdol, P. Lemonds, S. Van Cuyk, K. Lowe, R. Goldstein, and J. Rada. 2005. Quantifying Site-Scale Processes & Watershed-Scale Cumulative Effects of Decentralized Wastewater Systems. WUHT-02-27). Additional information can be found in Lemonds and McCray 2007.
Intermediate-scale modeling: The potential vulnerability of local water-resources to nitrate contamination from onsite wastewater systems in Adams County, Colorado was evaluated. Vadose zone modeling, using Hydrus 1D, suggested that the natural soils in the area would likely remove nearly all of the ammonium and nitrate in soil water originating from onsite wastewater systems. However, increased nitrate concentrations in the aquifer were possible. Because the model output was sensitive to the input denitrification rate, a monitoring program was recommended. Additional information can be found in Heatwole et al. 2005 (pdf) and Heatwole and McCray 2007.
Site-scale modeling: Site-scale processes have been quantified to provide increased understanding and modeling tools for applications involving individual onsite wastewater systems. An infiltration rate model (developed by Siegrist in 1987) that describes infiltration rate loss due to soil clogging development as a function of the cumulative mass loadings of TSS and total BOD, has been used to simulate the decline in infiltration rate consistent with field observations. Inverse modeling of the soil biomat enabled estimation of biomat saturated conductivities after one year of septic tank effluent loading to the soil. Numerical modeling of the soil treatment unis using Hydrus 2-D has provided insight in to expected fluid movement in the soil (Fig RA11). Additional information can be found in Beach and McCray 2003, Beach et al. 2005, McCray et al. 2005, Poeter et al. 2005, Siegrist et al. 2005, and Bumgardner and McCray 2007.
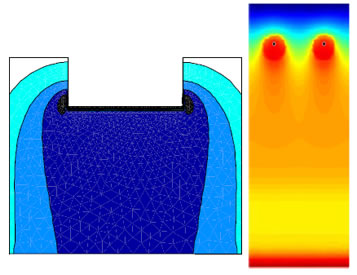
Fig RA11. Site-scale model simulations of a trench with mature biozone (Siegrist et al. 2005) and a drip dispersal network.
Tool Development: A simplified approach was developed to predict nitrate attenuation in the soil based on easily obtained soil characteristics. Denitrification rates reported in the literature ranged from BDL to >150 kg N ha-1 day-1 with variations attributed to different measuring techniques, field data vs. laboratory data, and soil saturation. Denitrification rates were typically much higher in clayey soils compared to sandy or silty soils. A predictive relationship between denitrification rates and the soil water filled porosity and organic carbon content was established. Additional information can be found in Tuchloke et al. 2007 and Tuchloke 2007
A project is ongoing (WERF DEC1R06) to develop tools for estimating soil treatment unit (STU) performance. The tools will provide insight into the behavior of STU performance as affected by a range of conditions which then aids decisions during STU design and/or planning through better understanding. The focus of the tools is on nitrogen reduction, virus removal and wastewater organic contaminant fate and transport. The tools being developed are graphical tools (nomographs, look-up tables, cumulative frequency diagrams, and model output illustrations) as well as simple spreadsheet tools. Graphical tools enable assessments based on broad assumptions as a first cut to identify if performance goals are likely or unlikely to be met. Spreadsheet tools enable “what if” assessments to better understand the limitations and ranges of expected performance. The final project report is expected to be available in January 2010.